CLOUDMAN23’s WEB-LOG – AN INTRODUCTION
Filed under: Atlantic hurricane season, Atmosphere, Biosphere, Cloud photographs, Colin Toney's photography, Hydrosphere, Lithosphere, Spatial Sphere, Tonie A. Toney, Tonie Ansel Toney, Tonie Toney, Tonie Toney's photography, Tropical Weather, Weather (other than of tropical origin) | Tags: Condensation, Cumulonimbus, Dew point, Environmental spheres, Introduction to web-log, Mammoth Lakes, Mature cumulonimbus, Minarets, Orographic clouds, Orographic uplift, Sierra Nevada, Teaching and Learning
 Comments (1)
  For an explanation of this photo please go to the “Assorted Pics” page; the tab is near the top of this page.
DISCLAIMER: Some of the information on this site is published close to “real-time” particularly as it applies to tropical weather; so – check the posting date carefully. It is important to remember that this web-log is not an “official” source of environmental information. Please do not make any decisions based solely on the information found on this site or any other sites that are recommended here – unless they are official. Listen to your local authorities when conditions are life-threatening or there might be loss of (or damage to) property.
Caution – I often leave “dated” posts available because of certain potential tutorial value. I apologize if this causes you any inconvenience. Also, I do not recommend this site for comprehensive coverage of weather. There are times when I do not address significant storms. Above all, do not consider me to be an authority.
FOR AN INTRODUCTION
TO THIS WEB-LOG
PLEASE CLICK THE
SMALL”READ MORE”
CUE TO THE LEFT.
ALL O.K. – Irma Update – Cloudman23’s Florida Family
Filed under: Central Florida Weather, Citrus County Florida, Cloudman23, Damage reports, Gulf Coast weather, Hurricane Irma, Hurricane preparation, Hurricane preparedness, T. Ansel Toney, Tonie Toney | Tags: Atlantic tropical weather, Cloudman23 status report, Hurricane Andrew, Hurricane preparedness
Leave a Comment 
We and all family members (including animal members) are O.K. No damage to our home. Much debris to clean up but no hurry for that. Helping others is high on the list. All neighbors and friends are O.K. as far as I can tell. In this house the comfort level increased significantly about five hours ago and I’ll take credit for it (just joking about the taking credit part). Here’s the tale: I felt terrible for not having the American flag on display yesterday especially since it was 9-11. That date certainly didn’t escape me. But it was still too windy. I put it out in all of its glory at 12:37 pm today and our electricity came back at 12:38. So the air conditioner is on, the refrigerators and freezers are working and we now have water. And obviously we have an Internet connection. And most important of all, my father-in-law has Fox News (the only station his television set receives). I guess I should have put the flag out sooner!


Posting Mainly for Family and Friends – Irma pre-arrival report
This is probably nearing the end of my having an Internet connection. We are are ready as we can be at this point. All it’s going to take is one limb on a power line nearby. I suppose there is more that we could have done but time has run out. For example we don’t have a generator. I’m sure that we will lose electrical power and that means no water since we have a well. We have a considerable amount of water stored for drinking, spit baths, and minimal toilet flushing. We have a weather radio and an AM/FM radio both with battery backup. We have storm protection on each window, and strong garage doors. The 45 minutes or less it takes us to secure the storm shutters turned into 6 hours. For a while I didn’t think I’d be able to make them secure at all. I could not figure out the problem and was beginning to jury rig. Then Terrie (brighter than me) realized that when we had the house painted earlier this year, the painters must have gotten their sealer into both the locking rods and the key locks. Without them, the shutters would just flop around! I was strongly reminded that “The best laid schemes o’ mice an’ men / Gang aft a-gley” as Robert Burns reminds us in his poem “To A Mouse.” Gang aft a-gley = often go astray. That was yesterday for sure. It took a lot of time and a lot of solvent to get things working! I had been so full of pride and satisfaction for having the sense, in 2005, to invest in shutters (instead of other things I would have rather had) but those convenient, costly things were a lot of work this time. We were exhausted. I just took it for granted that it would be an easy job as usual. Duhhhhhhhhh
Tonie
Hurricane Irma Entry – 9-7-2017
Filed under: Atlantic hurricane season, Caribbean Weather, Central Florida Weather, Citrus County Florida, Cloudman23, Cone of Uncertainty, Florida Weather, Hurricane preparation, National Weather Service Plot, T. Ansel Toney, Tonie Toney, Tropical activity in the Atlantic | Tags: Hurricane, Tropical Weather
Leave a Comment 
The image above is from the NOAA National Hurricane Center. It is the 8 PM EDT Intermediate Advisory for hurricane Irma.
Here is a link to that site: http://www.nhc.noaa.gov/
I have no particular “feel” for the path that this storm is going to take. It appears that my “zinger” notion yesterday for a right turn greater than the experts were anticipating might have been about as meaningful as a small rat’s flatulence in a Fujita-5 tornado. But, I’m still clinging to hope.
The mass migration from South Florida is effecting us here in Citrus County. Log-jammed I-75 is about 17 miles due east of my home. Today I took my father-in-law to our “late breakfast” in Inverness where we get together weekly with some other buddies. The drive home northward on U.S. 41 involved extreme congestion. What was happening is this: Some northbound traffic on I-75 was exiting at eastbound U.S. 44 and driving on in to Inverness before heading back north on 41 – many probably guided by the GPS features in their vehicles. Sadly, even before that started happening, our gas stations were on empty.
I understand from television news that lodging in Florida is getting extremely difficult to find. Even in Atlanta, I-75 has been experiencing overload. This is one reason why we are not migrating. I fear we would end up in a traffic jam of monumental proportions.
So, I’m hoping that the morning brings favorable news. My wish is that this storm goes out into the open Atlantic leaving us all in peace. But, that is most certainly NOT in the forecast. As each hour passes, such a lucky turn seems more and more like an irrational fantasy. My heart goes out to all of those who are traveling tonight – not knowing what they will be returning to once this is all over. Actually, my heart goes out to everyone threatened by this storm. I remember clearly what it was like returning to our totaled home in Homestead, Florida after Andrew plowed through on August 24, 1992. That event changed our lives forever. Driving in we hardly recognized the scene. Even the street signs were down! Because of debris we were unable to get down our street in my van. Paradoxically, only one pane of glass on our house was damaged and that was a mere crack. It was something that could have been easily taped to prevent air from getting through until I got around to replacing it. You see, we had storm shutters on every window. The trouble is, the roof failed! So much for preparedness. LOL I admit that I have higher hopes this time; every window of this Citrus County home is protected also and it was surely built to a higher standard. We’ll see.
I won’t go into specifics but, as has happened so many times in the past, I was surprised today by a few of the misconceptions about hurricanes that I heard expressed while I was out and about. For those of you who are interested in common misconceptions about hurricanes, here is a link:
https://cloudman23.wordpress.com/2008/09/23/952/
IRMA POSTING – PLUS
Filed under: Atlantic hurricane season, Central Florida Weather, Florida Weather, Hurricane models, Hurricanes, T. Ansel Toney, Tonie Toney, Tropical activity in the Atlantic, Tropical activity in the Caribbean, Tropical Weather, Tropical Weather Alert, Weather Satellite images | Tags: Atlantic tropical weather, Central Florida Weather, Coriolis effect, Dr. Jeff Masters, ECMWF model, Florida Weather, Hurricane Irma, Tropical Weather, WeatherUnderground.com
Leave a Comment  – click mouse twice for full enlargement of this image –
FIRST ENTRY IN MORE THAN A YEAR – 9-6-2017
I apologize to those few of you who have been consulting this weblog. My last posting was August 31, 2016. I’m still going strong and my interest has not waned. I’m still in the learning mode and intend to stay there. But it’s been a long time since I retired from teaching full-time college geosciences in 2003 and a lot has changed. I continued adjunct teaching after I retired but then moved away from South Florida in 2005. From 2006 into 2013 I taught 14 short-term courses at the College of Central Florida. Interest in this weblog seems to have diminished since I stopped formal teaching. However, when I checked this site this morning I saw that it has gotten tons of hits over the last few days, probably due to hurricane Irma. Prior to this current event almost all geoscience questions and observations that have come my way have been from a few family members, a few neighbors, and one buddy at church. It is very rare for me to hear from former students.
In-so-far as weather reporting is concerned, the information available to the public has blossomed since I retired and, for the most part, its quality has improved to the point that there is little if anything I can add (beyond basics). Many of my notions concerning tropical weather events fall into the category of hunches or intuition. I don’t believe that my 37 years of teaching meteorology full-time gives me license to clutter minds with my ideas unless I’m honest about them. Instead, in the comments below about Irma, I will share the four tropical weather resources I consult most often.
I am planning a change of theme and/or purpose for this site soon – more in the realm of discovery, opinions, observations, analyses, experiences, and perhaps some attempts at humor. The “About” page for this site was updated earlier today and if you wish to contact me, you will find my address there.
MY INPUT ON OUR CURRENT TROPICAL WEATHER
WHICH IS BEING DOMINATED BY HURRICANE IRMA.
My four primary resources are:
-
Dr. Jeff Masters’ weblog (blog) at WeatherUnderground.com. It can be found here: https://wwwwunderground.com/cat6
-
The Weather Channel on television and on-line – including apps. There are things about the Weather Channel presentations I don’t like. Nevertheless I appreciate the convenience and their efforts.
-
The National Hurricane Center. I go to this site to get a grip on what is going on in their world. I consider that they might tend to err on the side of caution, subconsciously at the very least. What an awesome responsibility they have. Http://www.nhc.noaa.gov/
-
The ECMWF Model – commonly referred to as the European Model.
I rely upon it heavily because of it’s premier reputation due to its accuracy over the last few years. It has done well for the “Irma type” storms. To be sure, I don’t ignore the other models. The following paragraph is for those who have been trying to understand that model.
You are likely to have heard many references to the European Model. I admit it is confusing. For example, here is a quote from Dr. Jeff Masters. “The European Center does not permit public display of tropical storm positions from their hurricane tracking module of their model, so we are unable to put ECMWF forecasts on our computer model forecast page that plots positions from other major models.” Thus, even though on television or on-line you may see comparisons of the European Model to the myriad other models, you might have noticed that it’s not included in the spaghetti charts that show models from multiple sources. What you will see is either the European “operational” model track or the European Ensemble (a spaghetti graphic). For that spaghetti ensemble the operational model is re-run at a lower resolution (called the control run) and this is then repeated 50 times, each with slightly different starting conditions.
I get my favorite animated European model track from Penn State’s Department of Meteorology at http://mp1.met.psu.edu/~fxg1/ECMWF0.5_0z/ecmwfloop.html
Please note that this link is time-sensitive.
Of the four charts, I focus upon the one on the upper right as I scroll through f24 through f240 ( which means “24 hours into the future” through “240 hours into the future”).
You might fry your brain with the time signatures on the bottom – depending upon your comfort level with time at the prime meridian (Universal, Greenwich, Zulu) and your knowledge of Victor time.
THE CORIOLIS EFFECT
I’ve been thinking all day long about the Coriolis Effect as it relates to Irma. If you are my former student you might recall that the steering currents at high altitude are, in part, a function of the Coriolis Effect (the Penn State chart on the upper left) and I’ll bet you remember that the counterclockwise circulation of Irma is due to the Coriolis Effect. If you’re still sharp on the subject you might also remember that the outflow at the top of the storm is likely to be clockwise for the same reason – the Coriolis Effect. I know that sounds like a contradiction to those of you who are unfamiliar with this subject. If you are interested in the Coriolis Effect go here:
https://cloudman23.wordpress.com/2008/10/02/the-coriolis-effect-in-the-real-world-a-tutorial-part-1/
and here:
MY NOTIONS TODAY ABOUT IRMA
Here is my zinger that comes from the “gut level” and is therefore probably not deserving of any classification other than “pure speculation.” (That’s the honesty I referred to in the second paragraph of this blog).
I am expecting (or is it hoping and praying for?) slightly more turning to the right than the experts are indicating. The itty-bitty turn last night was encouraging to me. I keep telling myself that the hurricane is a separate entity of its own and that the Coriolis Effect is influencing it’s path independent of the steering currents and the rotational motion. That path is the consequence of what is referred to as translational motion. Furthermore, the further north the storm gets, the stronger the Coriolis Effect will be. The Coriolis Effect is zero at the equator and increases to 100% at the poles. Maybe I’m just overly excited about last night’s noticeable veering of Irma’s path. Perhaps this is merely a good example of wishful thinking. We’ll see.
FOR CITRUS COUNTY, FLORIDA
Finally, for those of you who live in my county of Florida, Citrus, you might be interested in this August 2014 posting about hurricanes.
https://cloudman23.wordpress.com/2014/08/22/citrus-county-florida-and-hurricanes/
Tropical Storm Hermine – Tallahassee Alert –
Filed under: Central Florida Weather, Citrus County Florida, Cone of Uncertainty, Florida Weather, Gulf Coast weather, Tornadoes with hurricanes, Tropical activity in the Gulf of Mexico, Tropical Storm | Tags: Cone of uncertainty, Gulf of Mexico weather, Hurricane preparation, Tallahassee weather alert, Tropical Storm, Tropical Weather Alert
Leave a Comment
THIS IS A VERY “TIME-SENSITIVE” REPORT
After viewing the graphic below my concerns for the residents of Tallahassee have increased; of course it goes without saying that my concerns are for everyone who might have to deal with this storm – no matter where they might be located. Mainly, there are three factors involved in my concern for the 7th most highly populated city in Florida and its capital city. One is that there is a strong chance that Hermine will become a hurricane before reaching the Florida coast.
Another: The minimum distance from Gulf of Mexico waters to Tallahassee is about 25 miles. One might consider 25 miles to be an adequate “buffer” to provide friction and thus slow down the winds approaching the city. I think that assumption would be a mistake. Furthermore, when surface or near-surface winds leave the water for land the slight slowing that might occur would tend to cause more air to rise. A similar rising is what causes lake effect snows in certain Great Lakes coastal or near-coastal downwind locations. In the case of humid winds from Hermine possibly decelerating due to friction over the land when approaching Tallahassee, the net effect could very well be more vertical cloud development (due to a greater amount of rising air) than would have occurred otherwise. This phenomenon can intensify thunderstorms, the gusts that spill out from them, and the chaos that can generate tornadoes. The increase in rainfall amounts can be dramatic. So – be careful what you wish for. Flooding is typically a bigger issue than the wind velocities in these cases.
Here is the third cause for my concern: The graphic below from the National Weather Service showing the “cone of uncertainty” (8 PM EST, 8-31-2016) causes me to consider that Tallahassee might very well be under the right-hand leading quadrant of the storm when it makes landfall. The right-hand leading quadrants of tropical cyclonic systems are usually the quadrants with the highest wind velocities, greatest probability for tornadoes, heaviest rains, and in coastal areas the greatest storm surge height. The fact that currently the whole storm is beginning to move faster can increase the danger of the right-hand leading quadrant.
I urge residents of the Tallahassee area to be alert during the approach, passage, and departure of what is now Tropical Storm Hermine. Do not take it lightly just because it is on the low side of the tropical storm wind velocity range at this time (evening of 8-31-2016).
CLICK ON THE IMAGE BELOW TO ENLARGE.

CLICK ON THE IMAGE ABOVE TO ENLARGE.
Update On Tropical Depression Nine (AL09) 8-29-2016, 10:30 pm EST
Filed under: Florida Weather, Gulf Coast weather, Spaghetti models for today, Tropical activity in the Gulf of Mexico, Tropical Weather, Uncategorized | Tags: Florida Weather, Gulf of Mexico weather, Tropical disturbance, Tropical Storm, Tropical Weather Alert
Leave a Comment Compare this to the previous posting which was 24 hours earlier and you will see some change in the tracking model forecasts – which is to be expected.
I have greatest confidence in the TVCA run which is a consensus of 5 other models which have been good performers over the last few years. Generally, the TVCA model is very close to the National Hurricane Center’s “official” track that is the basis for the “uncertainty” cones released to the public. If you are one to pay attention to which models get mentioned or shown in weather reports you have surely heard of the “European model” which is labeled ECMWF. You won’t find it on these spaghetti illustrations; Data from this model is restricted from being redistributed according to international agreement. However, the National Weather Service official track runs very close to being the same as the ECMWF. The BAMM and related models are still useful for long term runs but in this case I think you can pretty much ignore them (the ones that run off toward the west).
Suppose you lived along the Nature Coast of Florida, (e.g. Citrus County) then you might feel that you have nothing to be concerned about because the tracks seem to be shifting northward. But please remember, these tracks are merely forecasting the storm’s center. In most cases the strongest winds are at the right hand, leading quadrant of such storms, which, in this case might cause Citrus County some concerns.
Please be sure to click on the graphic for enlargement.

Invest 99L Has Become Tropical Depression AL09
Filed under: Central Florida Weather, Citrus County, Citrus County Florida, Dr. Jeff Masters, Florida Weather, Gulf Coast weather, Spaghetti models for today, Tonie Toney, Tropical activity in the Gulf of Mexico, Tropical Weather Alert | Tags: Dr. Jeff Masters, Florida Weather, Gulf of Mexico weather, Tropical wave, Tropical Weather Alert
Leave a Comment REMINDER: THIS IS A TIME-SENSITIVE REPORT
As of late this afternoon, 8-29-2016, Invest 99L has strengthened to a tropical depression. For up-to-date information on the system, I recommend Dr. Jeff Masters’ weblog (blog). See link below:
Go to the top of the page and click on News & Blogs.
As of the time of this writing, Dr. Masters expresses reasonable confidence that the system will track in such a way that a landfall will occur somewhere in the Florida coast north of Tampa. I urge all interested persons to pay close attention to Dr. Masters’ postings, the Weather Channel tropical reports, and your local news.
Here is the most recent version from my favorite spaghetti chart source, the National Center for Atmospheric Research in Boulder, Colorado (CLICK ON IMAGE TO ENLARGE):

Citrus County Florida and Hurricanes
Filed under: Central Florida Weather, Citrus County Florida Hurricanes, Colin Toney's Photos, Crystal River flooding, Cyclonic Circulation, Florida, Florida Weather, Florida's Rainy Season, Gulf Coast weather, Homosassa flood potential, Hurricane misconceptions, Hurricane preparation, Hurricane Satellite Animation, Hurricanes in Citrus County, Kolin Toney's Photography, Shepherd of the Hills in Lecanto, the Brooksville Ridge, Tonie A. Toney, Tornadoes with hurricanes, Weather hazards | Tags: Citrus County hurricanes, Citrus County Weather, Florida, Florida Weather, Gulf of Mexico weather, Hurricanes in Citrus County, Storm surge
Comments (12)
Enlarge images in this posting with left clicks.
 ILLUSTRATION A. Big Lake Henderson from Inverness, Florida
– Please credit photo to Colin Toney –
 ILLUSTRATION B – map of Citrus County showing locations of the Gulf Coastal Lowlands which are subject to storm surges, the sandy Brooksville Ridge occupying more than one-third of the area, and the Tsala Apopka Plain containing the majority of the county’s fresh water lakes –
– TWO INDEPENDENT LEFT CLICKS ENLARGE THE IMAGE ABOVE TO THE FULLEST –
I Am Very Happy Living In Citrus County.
Of course, being retired, being a nature-lover and being relatively healthy helps. All locations have pros and cons but with respect to the latter I have yet to regret the move with my extended family 9 years ago. We had experienced hurricanes and tropical storms through the years. Our house was a total loss in 1992’s category 5 hurricane Andrew; it was at ground zero in Homestead which is located 27.6 miles (as the crow flies) southwest of Miami. The house belonging to my wife’s folks, less than a mile away, had extensive damage. What a terrible mess was caused by the only hurricane to make landfall upon the U.S.A. that season. But when we moved to Citrus County 13 years later we were conscious of the fact that by leaving South Florida we had NOT left “hurricane country.” I felt that Citrus County would be safer in that respect but certainly not a hurricane-proof location. It didn’t take long for me to meet people who felt that there was something special about Citrus and other nearby counties that made a serious hurricane event almost inconceivable.
Complacency is a real problem in hurricane country. I don’t claim to be an expert on complacency but there have been times in my life where I might have contracted the disorder I call “terminal uniqueness.” Therefore, I am acquainted with denial, ignorance, procrastination, irresponsibility, and “living in a dream world” because I’ve been there; for all I know, I’m there still. I believe that every time I point a finger at someone, three are pointing back at me and this is written in that spirit. Thus, I’m not trying to indict anyone here; I’m just trying to state what appears to me to be true.
As I see it – Citrus County, as a whole, though probably not the “geographical poster child” for complacency when it comes to hurricanes and tropical storms, seems to be after the title – in spite of its experience with “The Florida Four in 2004” (see illustration C below). I’m not speaking of those who vigorously engage in emergency planning and increasing awareness in the community. And of course I’m not speaking to residents reading this who have engaged in effective advanced planning and preparation. No, I’m speaking of the average Jack and/or Jill occupying a dwelling in Citrus County; I acknowledge that there are plenty of exceptions. To be sure – this is not a problem exclusive to Citrus County. I believe it’s prevalent in all or nearly all parts of the country susceptible to tropical cyclonic weather. Please click on this graphic below for enlargement.
 – ILLUSTRATION C –
The four 2004 storm tracks above are dated for your convenience. For example: Tropical storm Bonnie’s track runs from August 3rd to August 14.
NOTE: For an infrared satellite loop of the majority of the 2004 season, click on the first link below. Date and time indicators appear along the bottom margin. Then for an animated loop which is easier to interpret click on the second link.
Some History
I moved to Florida in 1956 during my high school junior year and I don’t remember a time since when I have not been conscious of the potential for tropical weather to wreak havoc upon lives and property and I have always tried to be prepared. If you were to have simply driven by my house you could have observed elements of hurricane preparedness. That is still true today. It is a high priority item in my family. I have been an active advocate of hurricane awareness and preparation for many years. If anything, I hope that illustrations in this weblog posting will increase awareness at least among the few who see it. So let me call your attention to the illustration below. Most residents who see such illustrations are, at the very least, surprised. Naturally some point out that this covers a long period of time. But really, is 161 years a long time in the whole scheme of things? My point in showing this is: TROPICAL CYCLONES ARE A REALITY IN CITRUS COUNTY. Also, please be aware of the fact that the plot lines show the paths of the centers of storms and that the storms have a width that is not apparent here. The center of a storm does not have to come within just a few miles for it to be of great concern; the center can be many miles away.
 ILLUSTRATION D -The circle has a 100 mile radius with Inverness, Florida in the center. Remember, left click for enlargement.
Even before leaving Homestead for good in 2005 – while visiting Citrus County I detected the existence of a notion of immunity to any sort of serious tropical cyclonic weather (e.g. hurricanes, tropical storms). Though I have no scientific evidence to back this – I classify the “no-need-to-be-concerned” feeling as widespread among the Citrus County population. In fact, sometimes “low-to-no” hurricane probability has been drastically overstated here (I’ve heard it and I’ve heard about it). It seems that “The Florida Four in 2004 ” did very little to squelch the delusion. Still – I would have expected that particular season to have provided a huge “wake up call.”
NOTE: The “official” Florida Four in 2004 includes hurricane Charley which struck Punta Gorda on August 13 and later moved through South Carolina. It does not include tropical storm Bonnie.
Just a few weeks ago I overheard a hostess at a popular restaurant in adjacent Marion County telling a booth full of patrons, “We just don’t get hurricanes here.” Recently a friend of mine suggested that there was something about our county’s geography, specifically the Brooksville Ridge, that prevented hurricane visits. That reminded me of Muncie, Indiana where I used to live; it is alleged to be immune from tornadoes because of a particular bend in the river flowing through it. Also, a protective blessing from an Indian chief has been cited.
http://www.ballstatedaily.com/article/2013/11/evidence-refutes-claims-of-tornado-myth
“The Florida Four in 2004” did not produce the extent of damage or flooding that raised eyebrows all over the nation and, for now, a sense of security from lethal storms seems to cling on. This is not a prediction nor is it my wish, but I do fear that a hurricane coming through this area has the potential to surprise a lot of people and make them wonder what they were thinking. And such an event could be deadly and most certainly destructive.
Storm Surge Potential
When I was looking for property in Citrus County one of my big concerns was the encroachment of wind-driven sea water with a storm – the so-called storm surge. Upon investigation I found what I expected – that if it was important to me personally to avoid surge potential I should avoid about one-third of the county’s land area – the western third.
NOTE: Illustration B, “map of Citrus County” might be useful to you here.
Most of that western third is undeveloped but there are two noteworthy communities within it, Homosassa and most of Crystal River. Therefore, early on I decided not to settle on the Gulf Coastal Lowlands but instead chose the Brooksville Ridge. In my opinion, the broad, hilly, sandy ridge is, by far, the safest place for a home or business in the county because of it’s higher elevations and greater ability to handle large amounts of precipitation often associated with a storm. The highest point in the county is within the Citrus Hills Golf Course above a 230′ contour – my Google Earth measurement has it at 235 feet.
 ILLUSTRATION E – Storm surge portion of Citrus County, the western third (color-coded). T = tropical storm and the numbers represent hurricane categories. Left click to enlarge or go to the next illustration for more detail.
 – ILLUSTRATION F – Two independent left clicks result in a significant enlargement.
FOR STORM SURGE ZOOM CAPABILITIES, click on this link:
http://www.floridadisaster.org/publicmapping/SURGE/SURGE_CITRUS.pdf
Other Concerns
To be fair, Citrus county seems not to have been visited by category 5 or 4 hurricanes though at nearby Cedar Key a 1896 hurricane was a category 4 according to some estimates – crediting it with 135 mph winds.
NOTE: As far as we know, only three Category 5 storms have struck the U.S.A. – the 1935 Florida Keys or Labor Day hurricane, Hurricane Camille which hit Mississippi in 1969, and 1992’s Hurricane Andrew. The records aren’t good enough to say whether any earlier storms were Category 5 by today’s standards and they don’t go back very far with respect to the length of time that such storms have visited the North American mainland.
But lesser tropical cyclones, like tropical storms and tropical depressions, can produce both microbursts and tornadoes and simple straight-line gusts can far exceed the sustained wind velocity of such storms. Of course this is true for hurricanes too. Illustration G below shows initiation points of tornadoes spawned by tropical cyclones (e.g. tropical depressions, tropical storms, hurricanes) from 1995 through 2010. The entire report is available in the PDF format here:

– ILLUSTRATION G –
Please enlarge this with a left click. This illustration is on page 7 of Roger Edwards’ report which is available to you as the previous PDF document link titled Tornadoes Tropical Cyclones.
Recently, I looked into the proximity of past storms near my church and created a graphic for those who might be interested. Since the church is located in Lecanto and near the geographical center of Citrus County, I’m including the graphic in this weblog entry. Notice that I picked a small radius of 25 miles yet the illustration clearly shows a lot of activity. Had I picked a larger radius, say 50 miles, the graphic would show many more storms ( for an example of what I mean, see illustration D with a 100 mile radius centered on Inverness).

– left click to enlarge –
– ILLUSTRATION H –
Note: If you would like to utilize the program I used to derive illustration D and illustration H, here is a link:
http://csc.noaa.gov/hurricanes/#
The Relationship Between Wind Velocity and Its Potential Force
There is one last point I’d like to make and I have found in my years of teaching that there are many people who do not know this: One would think that the potential force of an 80 mph wind would be twice that of a 40 mph wind. But that is not true. The relationship is not linear – it is exponential. An 80 mph wind has FOUR TIMES the potential force of a 40 mph wind. When someone looking at the historical chart above sees mostly tropical storms (green) and category 1 hurricanes (yellow) they typically tend to minimize the dangers. They don’t realize that an 80 mph category 1 hurricane wind is far worse than a 60 mph tropical storm wind. I’ve done the math and, as it turns out, an 80 mph hurricane wind has 1.78 times the potential force of a 60 mph tropical storm wind (or close to twice the potential force). So, in even more simple terms, small increases in wind velocity result in large increases in potential force! For more discussion on the relationship between velocity and force, click on this link to a previous weblog entry:
Wrap-up
My next mission is to discuss this with some people in the area to learn their attitudes and feelings on the subject. I’m sure I will learn a lot and gain more knowledge and insight. For example, I’ll bet there are some who just don’t feel it’s worth the effort – that they will just evacuate and let insurance take care of things, or maybe take some losses and leave for good if a serious storm messes things up. Others must find permanent window and door protection to be “cost prohibitive” and have plans to somehow temporarily protect those openings – maybe at the last minute. None of those approaches work for me; there are just too many variables. For example, try buying plywood when it becomes fairly clear that a hurricane is coming your way. Or – consider what it might be like if you do plan to evacuate but wait too long and are unable to do so. Being inside a home that is breaking apart during a serious hurricane is no picnic.
NOTE: See link below to “Window Protection Is Essential”.
I suspect that there are many who feel they have thought things through and that their apparent inaction is merely a function of our individual differences in thinking. Perhaps they do indeed have a “plan” albeit different than mine. What’s the saying – “Different strokes for different folks”? Regardless, I strongly recommend advanced preparation.
The complacency I’m talking about is defined at Dictionary.com as “a feeling of quiet pleasure or security, often while unaware of some potential danger, defect, or the like.” I observed complacency among many people in pre-Andrew Homestead and suspect it exists there again because, after all, that was 22 years ago. So why should I expect a greater awareness and more obvious preparation along the Nature Coast where Citrus County is located? The fact is, I don’t. But I can dream, can’t I?
MORE INFORMATION:
Recent FEMA Release: http://www.fema.gov/news-release/2014/08/22/decade-after-2004-storms-fema-urges-hurricane-preparedness
Citrus County Emergency Management – http://www.sheriffcitrus.org/EM/
Disaster Preparedness (Florida Department of Health – Citrus County) http://www.floridahealth.gov/chdCitrus/disasterpreparedness.htm
Hurricane misconceptions: https://cloudman23.wordpress.com/2008/09/23/952/
Saffir-Simpson hurricane categories: http://www.nhc.noaa.gov/aboutsshws.php
Sustained winds: http://www.aoml.noaa.gov/hrd/tcfaq/D4.html
Window protection is essential: https://cloudman23.wordpress.com/2008/09/08/window-protection-for-hurricanes-is-essential/
The effects of hurricane winds upon a house: https://cloudman23.wordpress.com/2008/09/10/the-effect-of-hurricane-winds-upon-a-house/
Hurricane focus on Central Florida: https://cloudman23.wordpress.com/2008/09/13/hurricane-focus-on-central-florida/
Why is Florida so humid? https://cloudman23.wordpress.com/2009/07/04/why-is-florida-so-humid/
Virgil Oren Toney
Filed under: Ansel Toney, CL-41, Farmland Indiana, Oren Toney, Tonie Toney, U.S.S. Philadelphia, Virgil Oren Toney, World War II Veterans | Tags: Ansel Toney, CL-42, Farmland Indiana, Muncie Indiana, U.S.S. Bordelon, U.S.S. Philadelphia CL-41, U.S.S. Savannah, Virgil Oren Toney, Warner Gear
Comments (3) 
Photo – October 2013
Virgil Oren Toney (my uncle Oren) died peacefully on Sunday, June 29, 2014 in his Indiana farm home. He was 89. He is the focus of this web-log entry*.
*I’ve entered this posting primarily for family and friends. “Friends” include neighbors, my former classmates and other school chums, members of my church, my dear former students (who more than likely heard me make references to farm life and/or my wonderful family) and others. I do not participate in social media communication because I fear that I might spend too much valuable time doing so. Therefore, I’m using my web-log as an outlet.
♥ ♥ ♥ ♥ ♥ ♥ ♥ ♥ ♥ ♥ ♥
My young mother was 16 when I was born in California in 1939. My father was 24 and had already served a full “hitch” in the Navy; however, he was pulled back in by World War II and served in the Pacific Theater as a Seabee. He returned in February, 1946 with both physical and emotional issues – both of which went untreated. Insult added to injury when his group returned from the War without fanfare and he had a tough time finding a job. Also, he more or less returned to a mess and his usage of alcohol increased. My dad, Don, had a good mind and a good heart but, in spite of that, things pretty much feel apart. He and my mother separated in 1949. He stayed on as a bartender in California while mom, Margaret (Maggie) and I bused to Muncie, Indiana to live with my maternal grandparents. This occurred shortly before my 10thbirthday. I was in the third grade. Thus, mistakes made by both of my parents led to an eventual divorce. The situation in California would have been bad for any child; there is no need to go into more detail. It suffices to say that the breakup, though painful, was in my best interest; I feel certain that my welfare was one of mother’s leading considerations.
I spent almost 3 days with dad during the late summer of 1950 when he took me to New York to see the final game of the World Series and then visited his Hoosier family. Then there was a two day period in 1954 when he came back to Indiana for the funeral of his brother, Elvyn. I did not see him again until 1961 when my dear Uncle Oren and Aunt Marge drove all the way out to California with their three young boys and me in their small Ford station wagon. Elvyn, named for the uncle he never saw, was in diapers. We did a lot of camping on the way out and back and, because of the places we visited (e.g. Yosemite) my interest in geology and meteorology blossomed. Shortly after I returned from this trip I changed my major at Ball State to earth sciences, now often referred to as the geosciences, and eventually completed a graduate study there. Thus, Oren and Marge were instrumental in my selection of a career and also instrumental in my having the will to stick it out in spite of the long hours of my full-time job. They had a great deal to do with the fact that I never felt alone. In fact, I’ve never felt alone in my entire life. I’ve always felt loved.
NOTE: After 1961 my father and I spent time together more frequently until the day he died in 1991.
My father’s parents, Ansel and Stella Toney, lived on a farm less than 15 miles east of the Muncie home. So, after mom and dad “split,” I was blessed with the great advantage of having both sets of grandparents in my life. I went to school in the city of Muncie and was technically, I suppose, a city kid. But I was able to spend considerable time, especially in the summers, on the farm working and playing and learning at a rapid rate. Learning a bit about honest, hard work was a blessing for me; much of it seemed like play.
Three of dad’s 5 siblings were close to home – the youngest “boy” Bill, the only “girl” Hazel, and Virgil Oren. Of the 6, Bill is the only one who remains alive today. Ivan Dunlap was in Los Angeles with his wife, May, and Elvyn was in Indianapolis with his wife, Lucille. Oren was a recently married 25-year-old when he became my primary role model. This happened very soon after I arrived in Indiana. At that time he and his brother, Bill, worked on my grandfather’s farm. Hazel lived in town (Farmland, Indiana) with her husband, Orpheus. Grandfather, Ansel Toney, later became well-known as the Hoosier farmer turned kite man.
Grandpa had a powerful influence upon me as did Bill. The same is true for my maternal grandfather, Harley, an absolutely wonderful man who set such a good example for me. But Oren was the one who I observed closely more than any other man, at least until my mother re-married when I was 15. Oren positioned me under his wing but he did not baby or spoil me. In other words, his wings were not typically soft and gentle; they sometimes came down hard but they were none-the-less good for me. He never did me any harm beyond triggering occasional and very brief hurt feelings in a hypersensitive boy. Timewise, that quickly diminished as I became more and more secure in my own skin. I credit him mostly for my experiencing that essential growth.
The importance of his wife (Aunt Marge) cannot be overstated. Describing her would require a very long chapter in any story of my life that included discussions of those who influenced me the most. Oren and Marge, as a loving couple, provided a model for those of us lucky enough to have the opportunity to observe. Additionally, his sons are like brothers to me.
Oren had already gone through the school of hard knocks by the time I got to Indiana. As a boy on the farm he grew up under conditions that were frequently difficult where he and his siblings had plenty of hard work to do. After the U.S.A entered World War II, he deliberately accelerated and increased his high school course load and managed to get enough credits for graduation before the end of the school year. At age 17 he joined the United States Navy. Enlisting prior to and thus missing his graduation exercise – his presence was symbolized by an empty chair. He served in both theaters of that war, European and Pacific. Miraculously, he lived through it. For the rest of Oren’s life the tender qualities of his heart and mind surfaced unmistakeably whenever he thought of those who didn’t survive. Among other terrible things, he had witnessed the direct hit of the light cruiser, U.S.S. Savannah (CL-42) by a radio guided German glide bomb. This occurred on September 11, 1943 during the invasion of Salerno, Italy. The Savannah had been the first American ship to open fire against the German shore defenses in Salerno Bay. The death toll aboard the Savannah from that glide bomb was 197 and 15 others were seriously wounded. From his battle station aboard his ship, the light cruiser Philadelphia (CL-41), Oren saw it happen and the memory stuck with him all of his life. I don’t ever remember hearing him mention it without tears in his eyes – pain and hurt in his voice. NOTE: Philadelphia narrowly evaded a glide bomb during that same operation, although several of her crew were injured when the bomb exploded.
Like all humans I know, Oren was not perfect. But he was perfect for me from the time I came home to Indiana with my mother until the day he died. He had more positive influence upon me than any man, with the possible exception of my stepfather. He played a most significant role in my internalization of an identity. Especially when he teamed up with his great brother, Bill, I was one of the luckiest boys in the world. As time marched on and we all got older, his importance in my life did not diminish. Decidedly different than Bill, there was one glaring similarity and that was their willingness to help others – whether or not they were family members. Once, not many miles short of a routine Air Force Reserve meeting at Wright Patterson Air Force Base, Ohio – my car broke down. Bill and Oren together rescued me; Bill drove his truck (his pride and joy) to tow the car all the way back to a Muncie repair shop where I had been given the privilege of paying off my repair bills in installments – without interest. It was run by the wonderfully helpful couple, Hank and Olive Swain.
Oren was clearly good to all of the spouses and the children of each generation loved him. People from all over the community, farmers and town dwellers alike, were so very fond of him.
Another World War II vet is gone. I’m not entirely joking when I often say, “Without him and others like him, we who now occupy the U.S.A. would probably be eating sauerkraut with chopsticks whether or not we wanted to – that is, assuming we had lived through the takeover.
My 4-year-long Muncie factory job (Beckett Bronze) that paid my college expenses and supported my small family was acquired on the basis of Oren’s reputation established when he had worked there. His recommendation got me in the door. He and his teammate, Marge, fed me and my family countless times at their kitchen table – the table that my daughter, Gina, has written about in a piece I have linked you to near the end of this posting.
I loved him so much. I’m sure that others have been similarly inspired by the goodness of Oren and Marge and I’m not the only person who has been guided by the two through times that would have been much tougher without them.
Here is his obituary written by his oldest son, Doug:
FARMLAND (Indiana) – Virgil “Oren” Toney, 89, Farmland, died Sunday, June 29, 2014 at his home.
Oren was a retired farmer. He also was retired from Warner Gear where he was a machinery repairman for twenty-seven years.
Oren was born on June 3, 1925, in Farmland, to Ansel and Stella Toney. He was a 1943 graduate of Farmland High School.
Oren joined the Navy at the age of 17 during World War II. He served proudly on the light cruiser USS Philadelphia in the Atlantic and Mediterranean Sea. He participated in the invasions of Sicily, Salerno, Anzio and Southern France. After Germany’s surrender, he was assigned to the destroyer USS Bordelon, where he served in the Pacific until February 1946. Note added: The Bordelon operated as a part of the occupation force in Japan.
He was a lifetime member of the Farmland American Legion Post and enjoyed attending annual reunions with his former shipmates from the USS Philadelphia.
Oren was married for sixty-five years to Marjorie Truex Toney, who survives. Other survivors include his brother, Wilbur “Bill” Toney, Farmland; two sons, Marc Toney, Parker City, and Doug Toney and his wife, Patty Ryan Toney, New Braunfels, TX; eight grandchildren; four great-grandchildren; numerous nieces, nephews, great-nieces and great-nephews.
He was preceded in death by a son, Elvyn Boyd Toney; his parents, Ansel and Stella Toney; three brothers, Ivan, Don and Elvyn, and a sister, Hazel Mae Meranda.
No visitation or public services are planned. A private ceremony for family will be conducted at a later date.
In lieu of flowers, the family has requested that memorial contributions be directed to the Rehoboth United Methodist Church, 3955 North 1000 West, Parker City, IN, 47340.
Related Links:
Written by my daughter, Gina in 2012: https://cloudman23.wordpress.com/tag/oren-toney/
My young mother (written Dec. 2, 2010): https://cloudman23.wordpress.com/2010/12/02/my-mother-12-2-2010/
Oren’s father/my grandfather: https://www.youtube.com/watch?v=SjKS_dkYhKk
Note: In the previous photo at the very bottom of the link grandpa Toney is with his son Bill (on the left side of photo wearing glasses) and Oren is on the right side of photo.
Light Cruiser Philadelphia, CL-41
http://en.wikipedia.org/wiki/USS_Philadelphia_%28CL-41%29
Destroyer U.S.S. Bordelon, DD-881
http://en.wikipedia.org/wiki/USS_Bordelon_%28DD-881%29
U.S.S. Philadelphia Service Record
http://www.ibiblio.org/hyperwar/USN/ships/dafs/CL/cl41.html

Shortly after enlisting in 1943.
 – left click on this photo to enlarge –
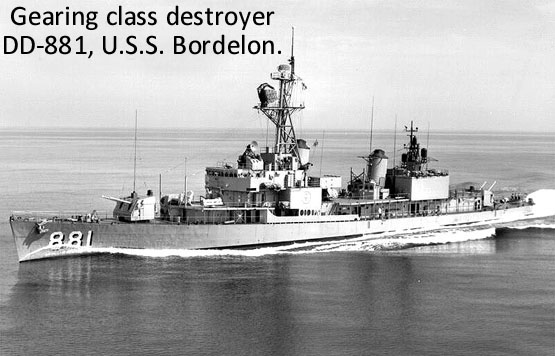
Oren landed in occupied Japan from this ship.

Flag lowered to half-mast moments after Oren passed away. Half-mast is the nautical term for half-staff.
Karen Is A Gulf Coast Concern
Filed under: Central Florida Weather, Cone of Uncertainty, Dr. Jeff Masters, Florida Weather, Gulf Coast weather, Hurricane models, Hurricanes, Tropical activity in the Gulf of Mexico, Tropical Storm, Tropical Storm Karen, Tropical Weather, Tropical Weather Alert | Tags: Dr. Jeff Masters, Florida Weather, Gulf of Mexico weather, Hurricane preparedness, Tropical Storm, WeatherUnderground.com
Leave a Comment  – Click on image to enlarge –
The graphic above is the Friday, October 4, 2013 10 a.m CDT (advisory #6) from the National Hurricane Center.
Those who follow this web-log know that my primary source of information regarding tropical weather is Dr. Jeff Masters of Weather Underground. His blog can be found by clicking on the “community” tab once you open the following page: http://www.wunderground.com/
It would be a waste of my time and yours for me to try to explain it any better. Here is his verbatim forecast report posted at 1:44 PM GMT on October 04, 2013
Forecast for Karen
Wind shear for the next three days is expected to stay high, around 20 – 30 knots, according to the 8 am EDT SHIPS model forecast. The atmosphere is quite dry over the Western Gulf of Mexico, and this dry air combined with high wind shear will retard development, making only slow intensification possible until landfall. A trough of low pressure and an associated cold front will be moving through Louisiana on Saturday, and the associated upper-level westerly winds will bring higher wind shear near 30 knots and turn Karen more to the northeast as it approaches the coast on Saturday. The higher shear, combined with ocean temperatures that will drop to 28°C, may be able to induce weakening, and NHC has sharply reduced its odds of Karen achieving hurricane strength. The 5 am EDT Friday wind probability forecast from NHC put Karen’s best chance of becoming a hurricane as a 23% chance on Sunday at 2 am EDT. This is down from the 41% odds given in Thursday afternoon’s forecast. Most of the models show Karen intensifying by 5 – 10 mb on Saturday afternoon and evening as the storm nears the coast, as the storm interacts with the trough of low pressure turning it to the northeast. This predicted intensification may be because of stronger upper-level outflow developing (due to diverging winds aloft sucking up more air from the surface.) We don’t have much skill making hurricane intensity forecasts, so I wouldn’t be surprised to see Karen do the opposite of what the models predict, and decay to a weak tropical storm just before landfall, due to strong wind shear. In any case, residents of New Orleans should feel confident that their levee system will easily withstand any storm surge Karen may generate, as rapid intensification of Karen to a Category 3 or stronger hurricane has a only a minuscule probability of occurring (1% chance in the latest NHC forecast.)
Since Karen is expected to make a sharp course change to the northeast near the time it approaches the south coast of Louisiana, the models show a wide range of possible landfall locations. The European and UKMET models are the farthest west, with a landfall occurring west of New Orleans. The GFS model is at the opposite extreme, showing a landfall about 400 miles to the east, near Apalachicola, Florida. NHC is splitting the difference between these extremes, which is a reasonable compromise. Most of Karen’s heavy thunderstorms will be displaced to the east by high wind shear when the storm makes landfall, and there will likely be relatively low rainfall totals of 1 – 3″ to the immediate west of where the center. Much higher rainfall totals of 4 – 8″ can be expected to the east. NHC’s 5 am EDT Friday wind probability forecast shows the highest odds of tropical storm-force winds to be at the tip of the Mississippi River at Buras, Louisiana: 66%. New Orleans, Gulfport, Mobile, and Pensacola have odds ranging from 47% – 51%.


